
CVE statistics
How many vulnerabilities are actually published each year? The charts you find on Google usually stop in 2021. This one reads NVD and refreshes every day.
Updated 19/10/2026
- 49 972CVEs published in 2025
- 137new vulnerabilities per day
- 3 365rated critical in 2025
- 7.7×more than in 2016
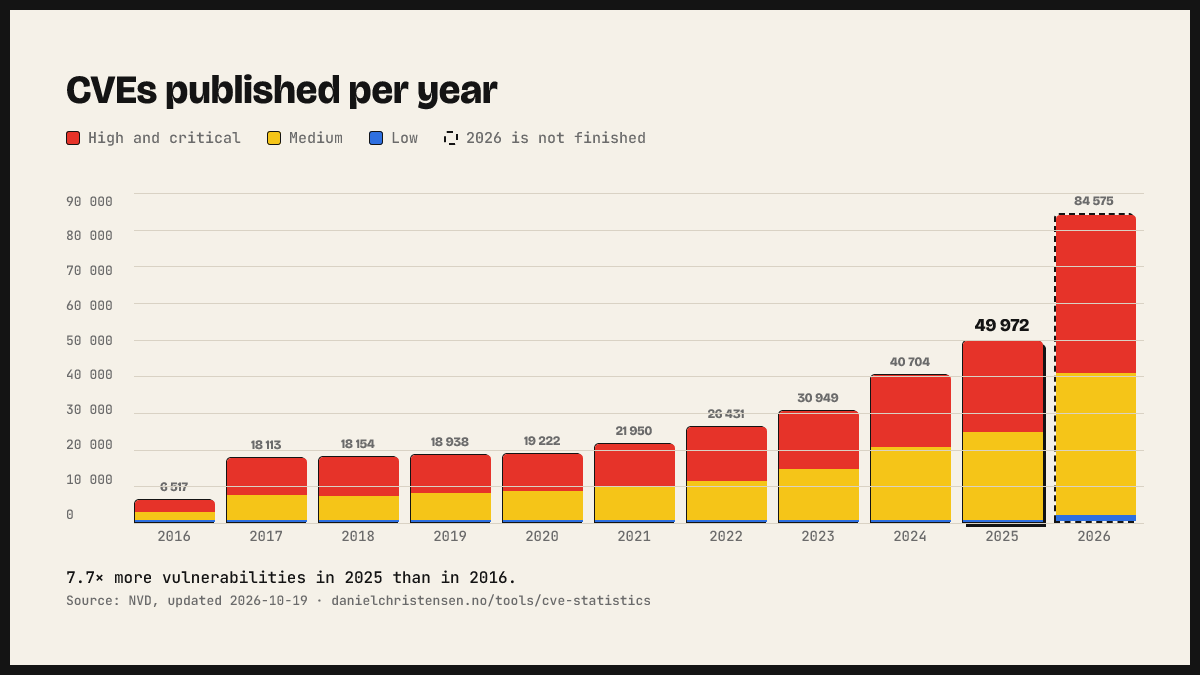
Published vulnerabilities per year
The bars are every CVE NVD published that year. The severity split follows the vulnerabilities NVD has managed to give a CVSS score, applied to the whole year. NVD has not scored everything, and the backlog is largest on the newest years.
The numbers, year by year
Critical, high, medium and low are NVD's own counts for the vulnerabilities it has scored, so they add up to the scored column rather than to the total.
| Year | Total | Critical | High | Medium | Low | Scored |
|---|---|---|---|---|---|---|
| 2026ongoing | 84 575 | 2 171 | 5 314 | 6 665 | 272 | 17 % |
| 2025 | 49 972 | 3 365 | 4 992 | 8 081 | 227 | 33 % |
| 2024 | 40 704 | 3 037 | 8 256 | 11 490 | 371 | 57 % |
| 2023 | 30 949 | 4 396 | 9 898 | 11 861 | 370 | 86 % |
| 2022 | 26 431 | 4 153 | 9 195 | 9 381 | 427 | 88 % |
| 2021 | 21 950 | 2 545 | 7 454 | 7 822 | 356 | 83 % |
| 2020 | 19 222 | 2 681 | 7 283 | 7 226 | 399 | 92 % |
| 2019 | 18 938 | 2 625 | 7 130 | 7 075 | 310 | 91 % |
| 2018 | 18 154 | 2 596 | 7 542 | 6 198 | 167 | 91 % |
| 2017 | 18 113 | 2 110 | 6 602 | 5 697 | 229 | 81 % |
| 2016 | 6 517 | 887 | 2 874 | 2 284 | 186 | 96 % |
What people ask
about CVEs

NVD has given 3 365 of the vulnerabilities from 2025 a critical CVSS score. That is among the 16 665 it has assessed so far, out of 49 972 published in total. NVD does not manage to score everything, so the real number is higher.
Numbers land. Stories are what people remember.
This chart is one slide in my talks on digital security. The rest is about what actually happens when somebody uses one of them.